Manage your
Onside is the only platform that speaks fluent agriculture. Bring your operation’s data, people and processes into one place, so you can manage risk with confidence.
Health and safety


Trusted by 9,000+ agribusinesses like:
One platform, total confidence
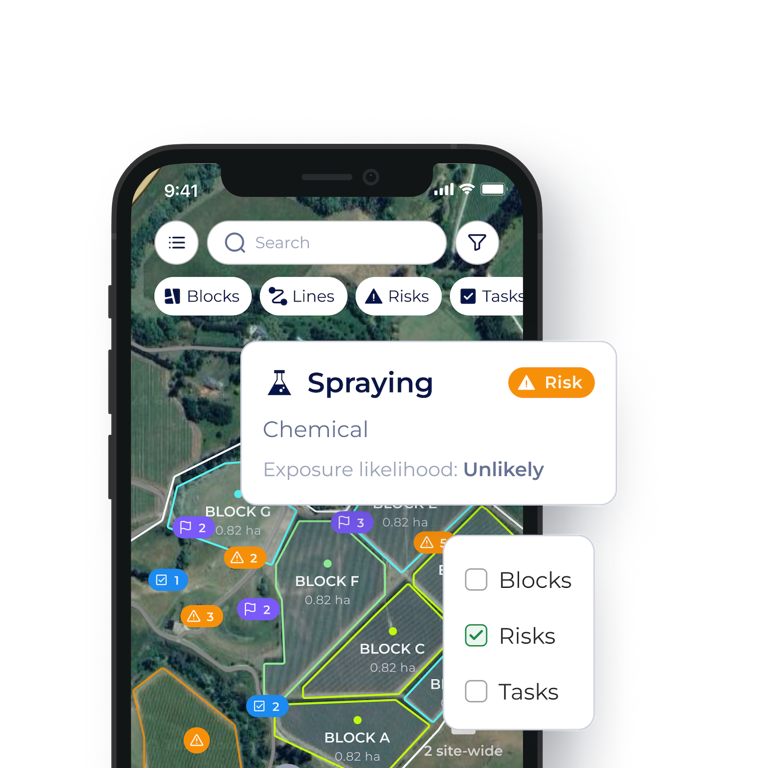
HEALTH AND SAFETY
Simplify health and safety with real-time risk management
- Map, share, and update risks instantly with Onside’s live risk register.
- Get instant risk alerts, evaluate severity, and respond swiftly.
- Document, analyze, and investigate incidents to prevent future risks.
- Generate instant safety, biosecurity, and visitor reports in one click.
Stay protected with a proactive approach that offers total peace of mind.
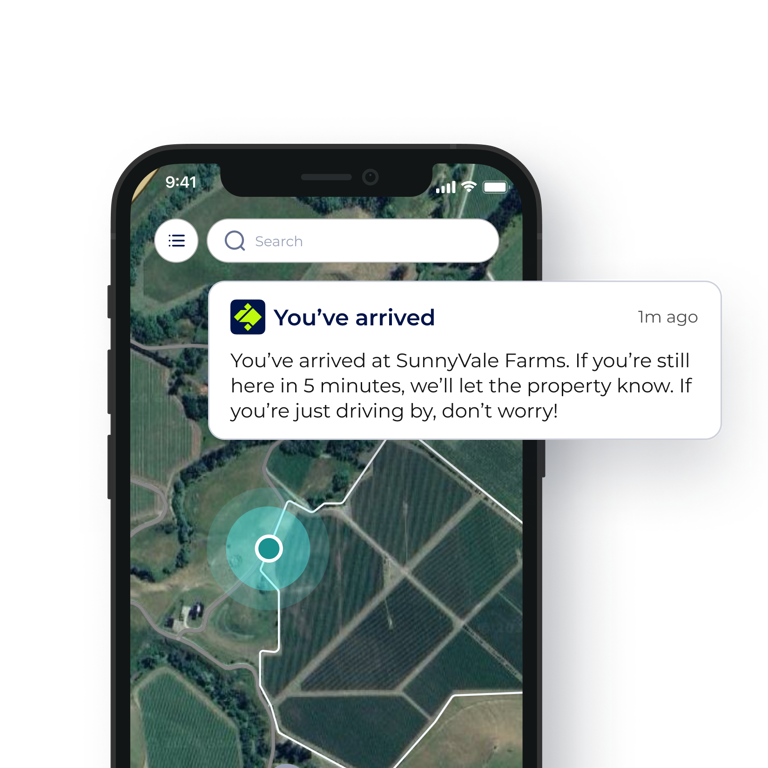
VISITOR MANAGEMENT
Automate check-ins, capture data, and optimise site operations
- Automate arrivals and departures for flawless visitor tracking.
- Digitally collect visitor data and streamline safety inductions.
- Receive real-time alerts for visitor check-ins and exits.
- Provide updated digital maps and essential site information.
- Generate instant visitor reports for operational excellence.
Better security, enhanced control, and efficient operations every day.
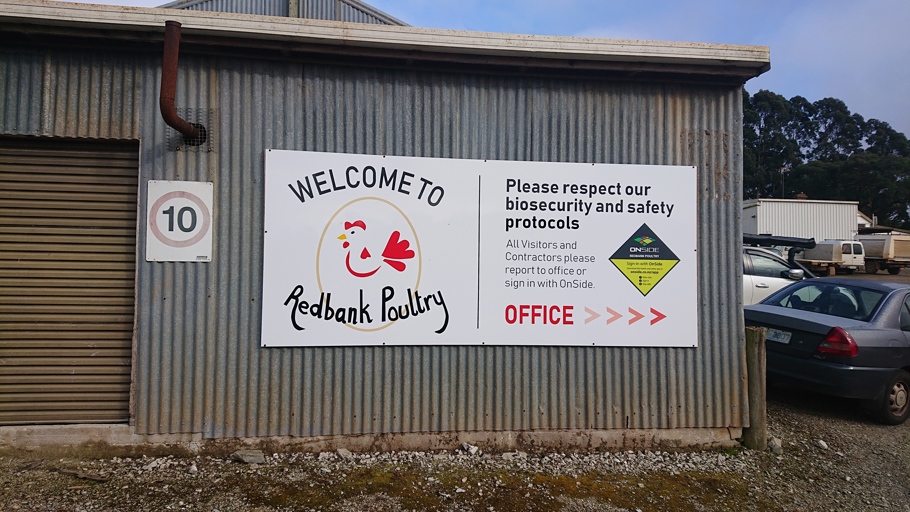
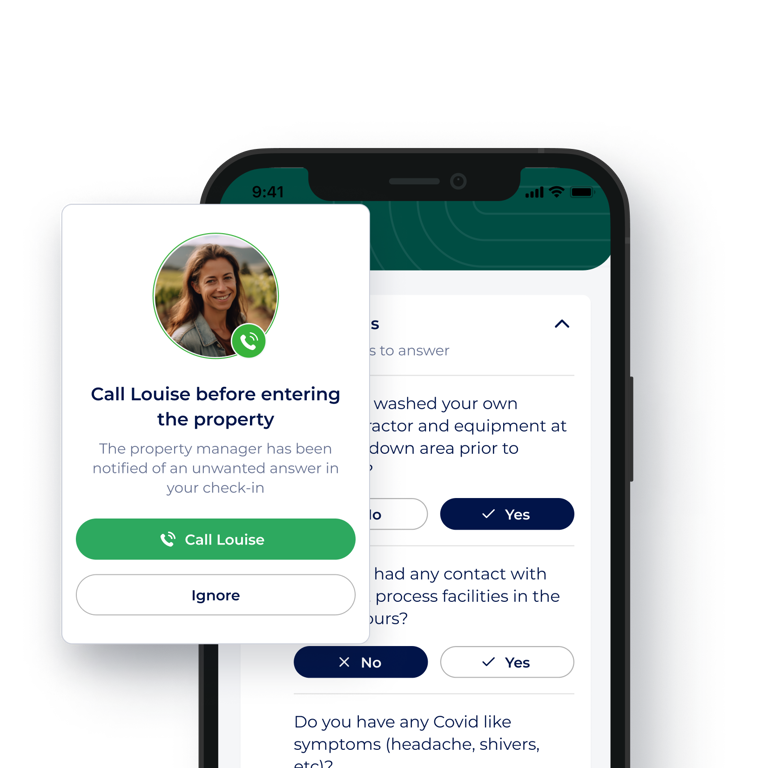
BIOSECURITY
Protect your operation with advanced biosecurity controls
- Automate biosecurity checks and get instant red flag alerts.
- Set custom stand-down periods with real-time breach prevention alerts.
- Track and trace movements and respond quickly to biosecurity risks.
Prevent or minimize biosecurity incursions, securing your bottom line.
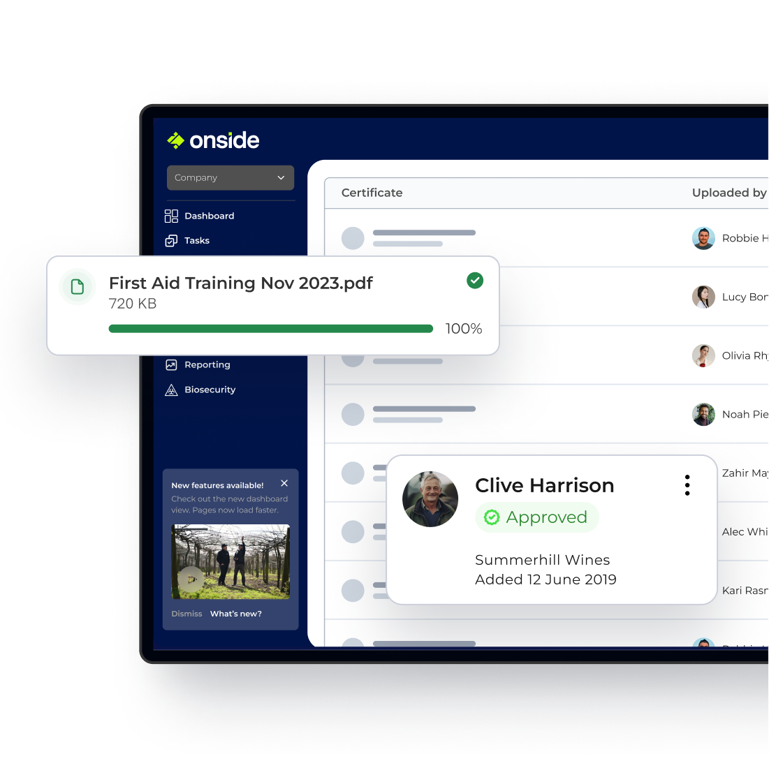
CONTRACTOR MANAGEMENT
Automate document sharing, inductions, and approvals
- Automate document sharing with real-time expiry alerts.
- Enable self-induction and safety onboarding.
- Automatically verify contractor eligibility and send alerts.
Optimize operations with efficient, compliant contractor management.
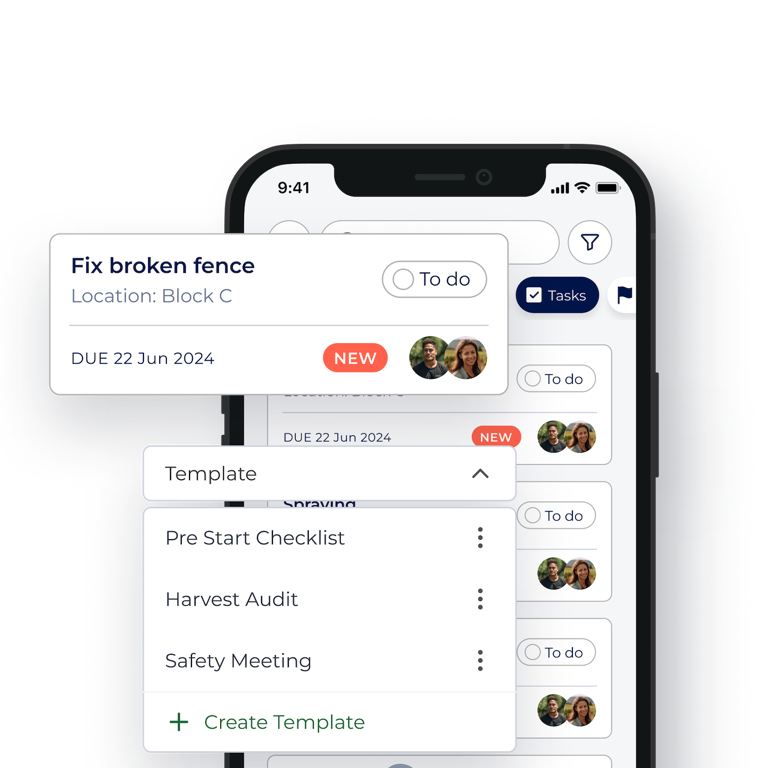
FARM OPERATIONS
Make your maps, tasks, and records more accessible for better compliance
- Create property maps with interactive, real-time location data.
- Assign tasks with details and pin to your digital map.
- Standardize tasks with pre-filled templates and checklists.
- Stay audit-ready with comprehensive, real-time compliance reporting.
Elevate your operation while ensuring unmatched safety and compliance.
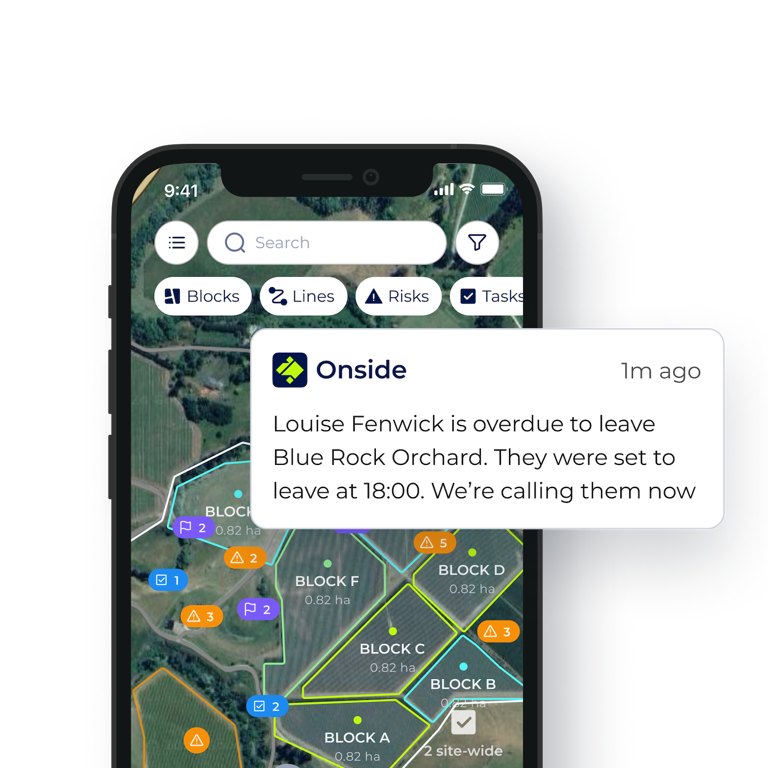
LONE WORKER SAFETY
Protect lone workers with real-time visibility and automated alerts
- See your team's check-ins and activity in one live dashboard.
- Receive alerts when workers don't check-out when they expected to.
- Trigger automated escalation calls to ensure worker safety.
Enhance safety, improve response times, and keep your team protected.
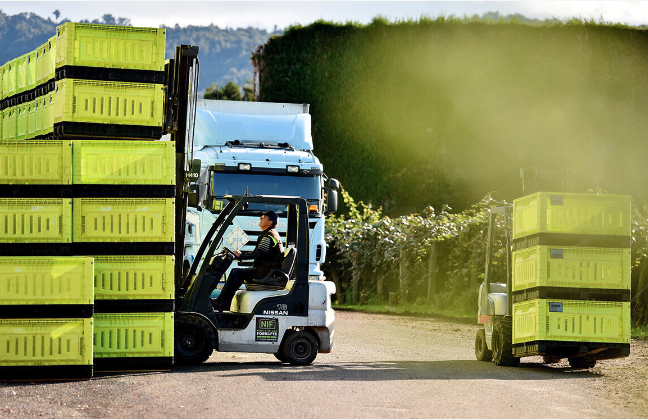
How Darwalla Group improves biosecurity with Onside
CUSTOMER STORY
Real stories from agribusinesses
Learn why other agribusinesses use Onside across their operations