A Guide to 2024 Australian Agricultural Statistics
Check out our comprehensive guide to Australian agricultural statistics for 2024, with insight into previous years and a vision for the future of the industry.
Data & Statistics

In recent years, Australian agriculture has been buffeted by challenges ranging from economic to environmental and beyond. While the worst of the COVID pandemic is behind us, there's no shortage of hurdles and opportunities for farmers and growers in 2024.
That’s why we've pulled together some of the latest agricultural statistics in a wide range of areas. This will deepen your understanding of the state of Australian agriculture in 2024, and help you prepare for the future.
Export statistics
With Australia exporting a record $78.1 billion of agricultural products in 2022, trade is more important to the sector than ever.[1]
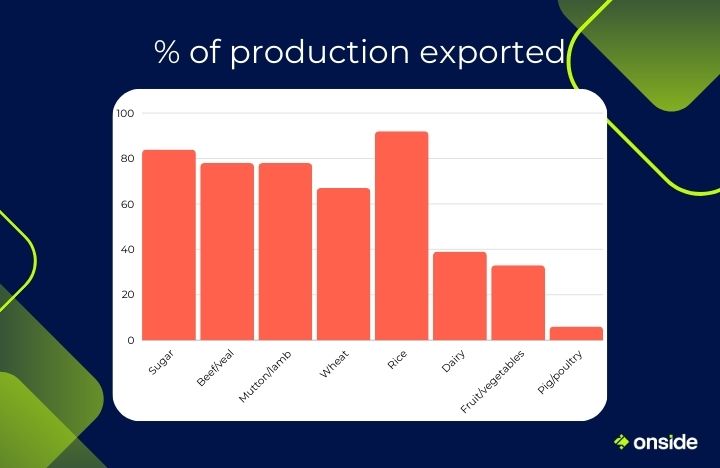
One insightful way to analyse the industry is to look at which products mostly remain on-shore, and which are predominantly exported. Farmers and growers looking to expand their business must consider this information when deciding on their approach. Tools like our farm management app and vineyard management software can help manage and optimise these processes.
- Based on a 3-year average from 2017-2018 to 2019-2020, Australia exports 72% of the total value of agricultural, fisheries and forestry production.
- 84% of sugar production is exported.
- 78% of beef and veal production is exported.
- 78% of mutton and lamb production is exported.
- 65% of canola production is exported.
- 67% of wheat production is exported.
- 92% of rice production is exported.
- 39% of dairy production is exported.
- 33% of fruit and nut production is exported.
- 6% of pig and poultry production is exported.[2]

Economic statistics
Economic conditions in Australia and around the globe remain complicated by the effects of COVID-19 and ongoing inflation.
Fortunately, there’s plenty of cause for optimism when it comes to the economics of Australian agriculture. In 2022–23 the value of agricultural, fisheries and forestry production reached an estimated record high of $98.4 billion.[2]
There’s no doubt that plenty of farmers and growers are enjoying strong economic conditions. However, the coming years will present challenges for agribusinesses to prepare for. If you need a helping hand, explore our 6 practical tips for a successful harvest season.
- ABARES projects the value of Australia's agricultural production will reach $78 billion in the 2023-24 financial year. This would represent a 17% decrease from a record value of $94 billion in 2022-23.
- In 2023–24, Australian crop production volumes are projected to fall by 19% from the record highs seen in 2022–23.
- The gross value of crop production is expected to fall by $12 billion to $46 billion in 2023–24.
- Wheat is driving around half of the decrease in projected value. It is projected to fall by $6.8 billion.[5]
- The labour productivity index (LPI) of agriculture, forestry, and fishing industry increased by 29% from 2012-13 (79.19) to 2022-23 (102.16). During this period, the lowest figure recorded was 72.57 in 2019-20.[3]
- The Gross Value Added (GAV) by the agriculture industry in Australia from 2014 to 2022 increased by 9.2% from $54 billion to $58.97 billion. During this period, the lowest point was in 8 2020 at $45.85 billion. The highest point was $62.07 billion in 2021.[4]
- This points to an agriculture industry that has handled the impacts of the COVID-19 pandemic and environmental challenges, and has continued to generate high levels of profitability. However, it’s important to keep in mind that economic output will fluctuate in the coming years.
Livestock statistics
Livestock remains a crucial aspect of Australian agriculture. There are several fascinating trends to note with regard to Australia’s livestock industry, including widespread growth in a number of areas.
A range of statistics reflect significant changes in the numbers of livestock slaughtered. While technological innovations such as lab-grown meat could present a challenge to the industry, the healthy present state of the industry should inspire optimism. If you’re in the industry, attending agricultural field days can help keep you up to date with these trends and innovations.
- In the 2022–23 financial year, cattle producers received $14.2b in proceeds for the sale of slaughter animals. This was 1.4% below 2021-22.
- In 2022-23, Australia produced over 2 million tonnes of beef.
- In 2022-23, the annual lamb flock reached 78.8 million head, the highest level seen in 15 years.
- 557,274 tonnes of Australian lamb meat was produced in the 2022-23 financial year.
- Domestic consumption of lamb meat reached its highest level in 8 years at 193,151 tonnes.
- In the 5 years between 2016 and 2021, there has been an increase in managed goats in Australia of over 80%.[6]
- In the 2022-23 financial year, approximately 2.78 million cows and heifers were slaughtered in Australia. This is a 3.3% increase on the 2.69 million cows and heifers slaughtered in the 1989-90 financial year. During this period, the highest figure was recorded in 2015, with approximately 4.76 million cows and heifers slaughtered.[7]
- In the 2022-23 financial year, approximately 8.67 million sheep were slaughtered in Australia. This is a decrease of 46% compared to the approximately 16.08 million sheep slaughtered in the 1989-90 financial year. During this period, the highest figure was recorded in 1995, with approximately 17.5 million sheep slaughtered.[8]
- In the 2022-23 financial year, approximately 22.7 million lambs were slaughtered in Australia. This was a 35.4% increase on the 16.1 million lambs slaughtered in the 1989-1990 financial year. During this period, the highest figure was recorded in 2018, with approximately 23.43 million lambs slaughtered.[9]
- In 2023-24, Australians are expected to consume the following quantities of meat each:
- 26.8kg of pig meat.
- 20.8kg of beef/veal meat.
- 5.56kg of sheep meat.[10]
Dairy statistics
Dairy is an area of Australian agriculture that has seen some of the starkest changes when compared to several decades ago. A massive growth in imported dairy presents changed dynamics for domestic farmers.
In addition, the export value of dairy products including cheese and milk powder is expected to have fallen at the conclusion of the financial year. Understanding these statistics is crucial for dairy farmers charting the course for their businesses.
- In the 2022-23 financial year, almost 344,000 tonnes of dairy were imported into Australia. This is the largest amount ever imported and represents a 536% rise from 30 years ago.[11]
- The gross value of milk production is projected to fall to $5.9 billion in 2023–24. This is a 4% decrease from the record $6.1 billion recorded in 2022-23.
- Farmgate milk prices are forecast to fall to 71.4 cents per litre in 2023–24. This is 5% lower than the 75.1 cents per litre seen in 2022-23.
- Milk production is expected to rise by 1% to 8.2 billion litres in 2023–24.
- In 2024, the export value of cheese is expected to fall to $928 million (down by 7% from $1.0 billion in 2022–23).
- The export value of skim milk powder is expected to fall to $587 million (down by 24% from $776 million in 2022-23).
- The export value of whole milk powder is expected to fall to $255 million (down by 24% from $333 million in 2022-23).
- The export value of butter is expected to rise to $99 million (up by 31% from $75 million in 2022-23.[12]
Horticulture statistics
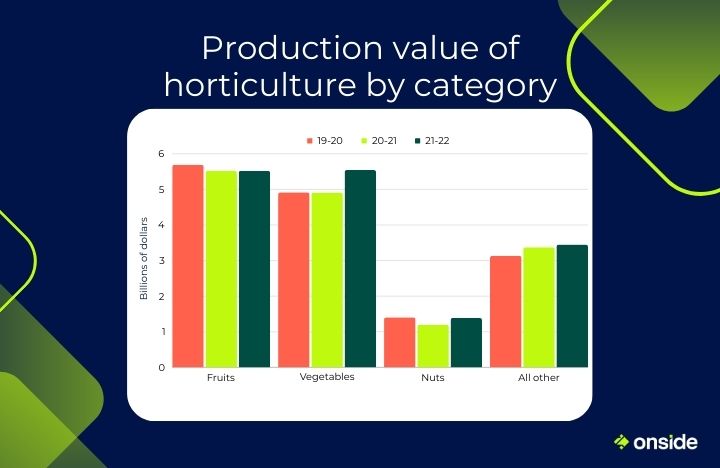
Horticulture continues to be a major component of Australian agriculture. These statistics reflect the split between the various categories of horticulture in Australia.
Production values of fruits and vegetables are dominant compared to other areas. However, there has been remarkable growth in certain areas. For example, Australia is now the second-largest almond exporter in the world, with exports reaching a value of $545 million in 2020-21.[13],[14]
Following these trends can make a huge difference for Australian growers' businesses.
- In the 2021-22 financial year, total fruit production was 2,551,740 tonnes.
- This production was valued at $5.522 billion.[15]
- Total nut production was 287,079 tonnes (in-shell) and 176,993 tonnes (kernel)
- The total value of Australia's nut production was $1.388 billion.[16]
- Vegetable production values hit a record high of $5.54 billion in 2021-22.[17]
- The production value of other horticulture areas was $3.45 billion.[17]

Poultry statistics
From chicken to eggs, poultry is critical to the dinner plates of everyday families. Unsurprisingly, the industry is an economic juggernaut.
Farmers from all areas of the industry should understand the dominant role poultry plays, and where it projects to go in the future. It might be the perfect opportunity for your agribusiness.
- In 2022-23, the gross value of Australian poultry farm production reached $3.105 billion.[10]
- The Australian Bureau of Agriculture and Resource Economics (ABARES) forward estimate for poultry meat production in 2022-23 was 1.367 million tonnes.[19]
- In 2023-24, Australians are expected to consume 50.4kg of chicken meat each. This represents nearly half of all meat consumed.
- In 2022-23, the export value of Australian chicken meat was $78.9 million. The export volume was 39,700 tonnes.[10]
- Over the 10 years to 2021–22, retail prices for poultry meat saw an average decline of 1.1% per year in real terms.
- In 2023–24, poultry meat prices on a real-terms, unit value basis are forecast to decline by 3.5%.
- From 2023–24 to 2027–28, poultry meat production is estimated to grow by an average of 1.7% per year.
- The value of Australian egg production was forecast to have increased by 19% to $1.1 billion in 2022–23.
- By 2027–28, the value of Australian egg production is expected to increase to $1.7 billion in real terms.[20]
Viticulture statistics
Viticulture has been at the centre of trade disputes between Australia and China in recent years. Tariffs introduced in 2020 added as much as 220% to the cost of Australian wine imported into Australia.[21]
However, with this dispute predicted to conclude in 2024, the calamitous impacts it has had should subside.[22]
This should prove a massive relief for Australian viticulture, opening the door for an industry ready to thrive in the future.
- Prior to the implementation of wine tariffs, in 2020, Australia’s export flow of wine to China was worth over $1 billion.
- According to Wine Australia's report released in mid-2023, the Australian winegrape crush for 2023 is estimated to be 1.32 million tonnes.
- This crush is 24% below the 2022 figure and the lowest since 2000. This has been broadly attributed to a third consecutive La Niña event.[23]
- By metric tonnes, each state contributed the following yield to the crush:
- South Australia: 661,984
- New South Wales: 321,991
- Victoria: 157,747
- Western Australia: 41,450
- Tasmania: 10,689
- Queensland: 489[24]
- The red variety crush was 711,777 tonnes, while the white variety crush was 605,321.
- The total estimated value of the 2023 crush at the weighbridge was $983 million.
- The average winegrape purchase price was $642 per tonne.
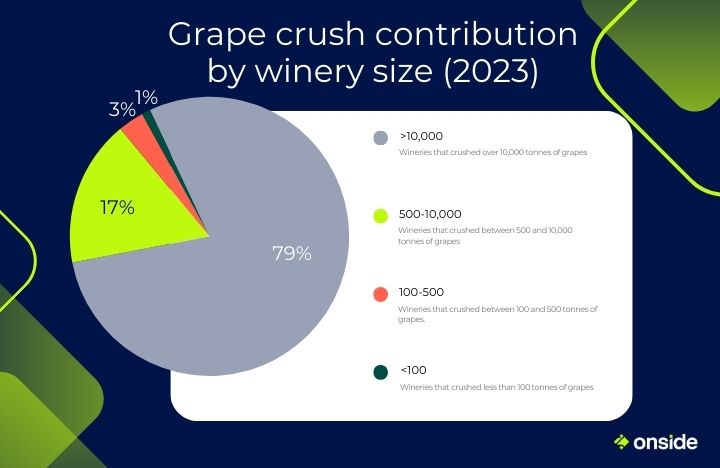
- The crush by winery size breakdown was:
- 79% by wineries that produced over 10,000 tonnes.
- 17% by wineries that produced 500-10,000 tonnes.
- 3% by wineries that produced 100-500 tonnes.
- 1% by wineries that produced less than 100 tonnes.[23]

Environmental impact statistics
Sustainability is top of mind for many Australians. Australian agriculture has a wide-ranging impact on the environment, which these statistics help shine a light on.
Understanding the specific impacts of the industry on Australia’s environments will enable your business to become more future-proof and ready for environmental standards that may arise.
- Australian agriculture accounts for:
- 55% of Australian land use (in December 2020).
- 24% of water extractions (in 2020-21).
- Australia's farm sector averages around 14-16% of national greenhouse gas emissions. This is slightly higher than the global average of 13%.
- This profile is expected to increase from 16% in 2022 to 20% in 2035.
- 80% of Australia's agricultural CO2-e (carbon dioxide-equivalent) emissions are methane from ruminant livestock.[2]
- From 1970 to 2020, agricultural output increased by 104%. In this same period, land used by agriculture fell by 28%.
- Land clearing in 2020-21 was 75% lower than it was 20 years ago.
- Australia uses just over 2kg of pesticides per hectare of cropping land. This compares favourably to countries like Brazil (almost 6kg/hectare), New Zealand (over 8kg/hectare) and the Netherlands (over 10kg/hectare).[25]
Health and safety statistics
Some of the most tragic statistics to track year-on-year relate to health and safety. Agriculture is unfortunately a dangerous field, which these statistics show.
These numbers highlight the importance of tools like Onside, which offers health and safety features including risk reporting and emergency plan creation.
- There were 44 fatalities in the agriculture, forestry and fishing industry in 2022. There were 14.7 deaths per 100,000 workers. This is by far the highest of any industry in the report.[26]
- Both of these figures are up from 2021. There were 33 fatalities in 2021, a rate of 10.4 per 100,000 workers.[27]
- There were approximately 3,900 serious claims regarding work-related injury and illness in the agriculture, forestry and fishing industry. Claims were made at a rate of 10.9 per 100,000 workers, the highest among any industry in the report.[26]
- Agriculture continues to be a dangerous industry relative to others. With tools like Onside, the industry can continue to take the necessary steps to become safer for workers.
Biosecurity statistics
As an island nation, biosecurity is crucially important to Australian agriculture. These statistics highlight some of the devastating impacts biosecurity breaches could cause to the industry.
Onside has worked with government departments and industry bodies to develop a range of biosecurity features. It helps farmers and growers comply with biosecurity needs and prepare for emerging threats.
It’s an important part of avoiding the devastating impacts of biosecurity breaches.
- In the absence of Australia's current biosecurity system, annual profits would be expected to decline:
- 8-12% for beef, dairy and sheep enterprises due to the higher risk of a foot-and-mouth disease incursion.
- 15% for pig enterprises.
- 7% for cropping enterprises due to a higher risk of a Karnal bunt incursion.[28]
- If the bacteria Xyella were to establish itself in Australia, the economic impact on the Australian grape vine industries would be an estimated $2.8 billion.
- The potential economic impact of a large, multi-state foot & mouth disease outbreak would be an estimated $5 billion for each year it was ongoing.
- Weeds cost Australia around $5 billion annually in control measures and lost production.
- Approximately 20 new weed species establish in Australia every year.[29]
The future of Australian agriculture
There are several key trends observed in recent years when it comes to Australian agriculture. These provide even more indications of where the industry is headed in the future.
You can get ahead of the competition by expanding your knowledge and this area, and becoming more agile as a result.
- There has been a significant reduction in the number of farm businesses in Australia over the last 4 decades. There were just under 120,000 dairy and broadacre businesses in 1980-1981 which met the minimum estimated value threshold to be counted by the ABS. In 2021-22, there were fewer than half that figure. Also playing into this figure is a greater diversity of farm types in Australia.[2]
- Caged egg sales will be phased out by Coles and Woolworths by 2025, and Australia at large will phase out caged egg sales by 2036. As such, increased production costs may result in higher farmgate and retail prices. However, demand is expected to be relatively unaffected.[20]
- Agriculture's share of Australia's carbon emissions is expected to rise to 20% in 2035. Pressure for the agriculture industry to develop more sustainable practices should be expected.[2]
- While there are plenty of challenges on the horizon for Australian agriculture, the industry appears to be well-positioned to continue to enjoy growth and a pivotal role in the Australian economy for years to come.
Prepare for the future with Onside
The agricultural sector continues to be one of immense challenge and opportunity. Whether you want to continue to grow your business’ profitability or tackle health and safety issues, Onside is the software to help meet your goals.
Onside offers a range of health and safety features from digital check-in, farm mapping and much more. It invites your whole team to come together and work towards a safer workplace.
It also assists with your day-to-day operations. This includes task management for smoother workflows and reporting tools to help with compliance.
Book a demo and discover all the benefits Onside offers your business.
References
[1]https://www.agriculture.gov.au/about/news/agriculture-fisheries-forestry-export-snapshot-2022
[2]https://www.agriculture.gov.au/abares/products/insights/snapshot-of-australian-agriculture
[4]https://www.statista.com/statistics/874367/australia-gross-value-added-agriculture-industry/
[5]https://www.agriculture.gov.au/abares/research-topics/agricultural-outlook/agriculture-overview
[6]https://www.mla.com.au/annualreport
[7]https://www.statista.com/statistics/719846/australia-slaughtered-cows-and-heifers/
[8]https://www.statista.com/statistics/722304/australia-slaughtered-sheep/
[9]https://www.statista.com/statistics/722578/australia-slaughtered-lambs/
[10]https://chicken.org.au/our-product/facts-and-figures/
[12]https://www.agriculture.gov.au/abares/research-topics/agricultural-outlook/dairy
[19]https://chicken.org.au/our-industry/industry-overview/
[20]https://www.agriculture.gov.au/abares/research-topics/agricultural-outlook/pig-and-poultry
[21]https://kpmg.com/au/en/home/insights/2023/11/china-wine-tariff-review-australian-winemakers-ti.html
[24]https://www.statista.com/statistics/963563/australia-wine-grape-crush-by-area/
[25]https://daff.ent.sirsidynix.net.au/client/en_AU/search/asset/1034821/0
[26]https://data.safeworkaustralia.gov.au/insights/key-whs-stats-2023
[27]https://www.safeworkaustralia.gov.au/sites/default/files/2023-01/key_whs_stats_2022_17jan2023.pdf